Perils of technology investment

Two interesting themes underlying this article: 1. Clever technology doesn’t always make a great business, 2. The Innovators Dilemma at work in big corporates strangling the babies , “The smarter news apps are, the dumber they get…” at  http://www.news-republic.com/Web/ArticleWeb.aspx?regionid=4&articleid=19972244

Posted from WordPress for Android

What the Bell?

I was rather interested to see a post on LinkedIn recently about “The Myth of the Bell Curve” which was saying (relatively) recent research had shown that human performance is more like a Power law distribution, than a Normal distribution.

The consequences of this is that a cherished HR sacred cows needs slaughtering.  Anyway you can read the post yourself, however, what tickled my interest is what would the two distributions look like when laid next to each other.

There is an image in the publicity material that attempts to show this…

image

…but that must be mathematically wrong, surely!

Nurse, bring the oxygen!

Both the Normal Distribution and Power Law are both types of probability density functions. however, as far as I can see from the published links, they have different axes:

  • Normal Distribution:  X = performance metric, Y = probability of that performance metric
  • Power Law :  X = some indicator of population; Y = performance metric of some sort

The problem of comparing these two is is that you need to rework the data to get both on the same axes.  Making the hypothesis that the x-axis of the Power Law is the performance rank of an individual – like a Zipf curve equivalent.

So X is not the size of the population, ‘cos that is just absurd:  the curve would otherwise show that for that any population of 1 is really brilliant, whereas the bigger it gets the more stupid it is…mmmm, weelllll, depends on who is counting themselves as the One, and how many of the rest read the Daily Mail/Mirror/Express/Sun/Star…

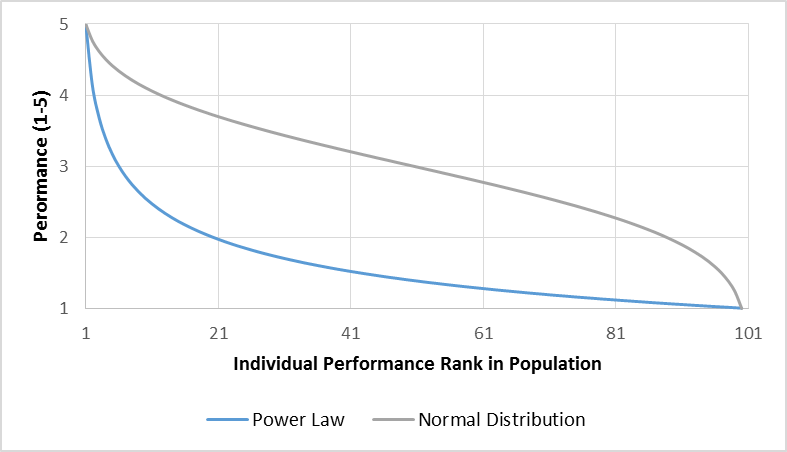
So if you work the data on that basis (modelling an arbitrary population size of 100 people) then the curves actually look like this…

Power law

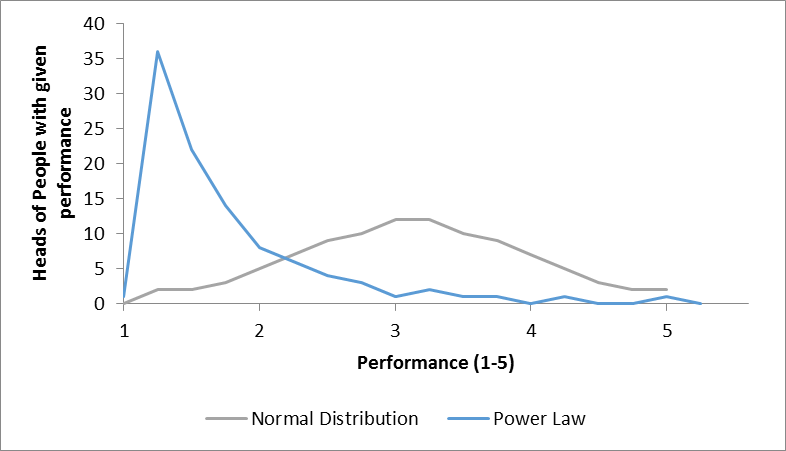
…so they are curves with quite different shapes.  And if you re-plot them the other way round, then they look like this…

Normal

…which might superficially look like the picture at the top, but is actually showing the population of the long tail as the tall spike, not top performers.

Still a rather scary picture, as it indeed suggests that most of the people in the “team” are rather serious under-performers, hanging on the coat-tails of the many fewer high-flyers!

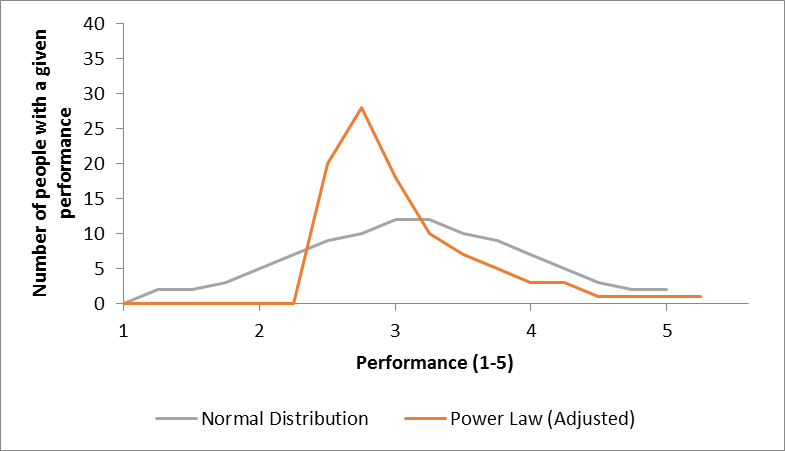
This may be a figment of the example data somewhat, and taking a probably unsubstantiated analytical leap, we can readjust the power law chart to align the median figures of performance and come up with a chart like this…

Normal (power adjusted)

…which even still suggests that there are a load of sub-middle slackers sitting on their hands, and they should really get moving and DO SOMETHING!

My general theory that if when leaving the house on the way to work in the morning, you harbour the thought that “today, “I will not make a difference”, go back indoors and get back under the duvet.

So I have scratched my itch, not sure it was so much fun for you, so here is another useful framework to help guide thinking and action and considers the destination of projects…

Thinking is…

..rigorous

A wasted opportunity swirling round the Plug-Hole of Life

Nirvana

..waffly

Hell,
by way of a path of good intentions

Nuremburg

..waffly

..rigorous

Implementation is…

Valley of the Blahs: How Justin Bieber’s Troubles Exposed Twitter’s Achilles’ Heel – NYTimes.com

There is a tipping point when the cost of monitoring the volume of status updates exceeds the benefit derived.  For me the limit is about 50 items, anything beyond is just noise or unnoticed ripples in the life stream.  Same reason I signed off Usenet 30 years ago.

http://mobile.nytimes.com/blogs/bits/2014/01/25/valley-of-the-blahs-how-justin-biebers-downfall-exposed-twitters-achilles-heel/?hpw=&rref=technology

Posted from WordPress for Android

In Depth: Plastic fantastic: why 3D printing is heading to a home near you

I can envisage that many people will not have the skills or interest for 3d CAD to create the original object designs, so the supply chain for creating and delivering the model data will be very important if this is to take off

In Depth: Plastic fantastic: why 3D printing is heading to a home near you – http://pulse.me/s/KP7Za

Posted from WordPress for Android

Whither the Customer Journey…

As we have discussed before, the “Customer Journey” is a tool beloved of Marketing people: a near biblical process of revelation delivering an earth-shattering thrill and delight to the lucky consumer – in all, the full showmanship to make buying a salad into a creative “event”.  Indeed, this hell of the “in-shop experience” was visited upon me again in M&S at Paddington Station on Monday evening, my bags hanging off my broad shoulders…

You may ask why I carry my bags when I could have all the convenience of a nice little wheeled travel trolley.  And I answer:

1. I am taller than average (although not in the league of Optimus Prime), and the little trolleys give me backache as the handle is designed only for average height mortals and so I have to bend down to pull, an royal ergonomic PITA (or lower back)

2. Only little old ladies pull trolleys around…to go to the shops

…down this narrow alley of snackery and sugar-filled delights holding my pathetic little pile of greenery, sweeping all behind me off the shelves.  Damn it!!!

And I forgot to pick up a fork in my rush to exit from the tills.  So there’s the bug in the experience, the journey was not “joined up”, it was NOT a good experience for me, I was NOT thrilled, I was NOT delighted.

Thinking back across the years about the perennial search for efficiency in its many forms, you can see an evolution in the focus from Functional (early industrial), through Process Reengineering to Customer Experience (with a brief diversion through Excellence and Chaos, courtesy of Tom Peters).

In the 1980s, the essence was this below – joining up the broken bits of process…
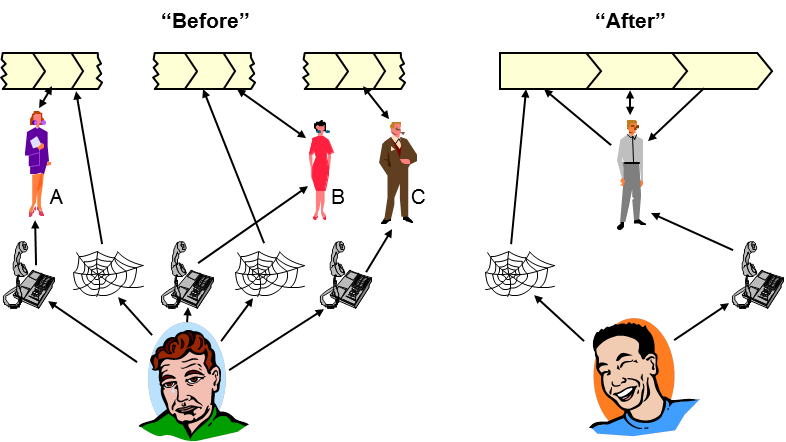
Joining up customer experience

…so that a bloke in a blue jersey gets to be deliriously, insanely happy.

But whilst everybody was futzing with their processes, they were missing the big picture and that in some cases the processes where anyway stupid, idiotic and annoying and the organisation just shambled from one disastrous event to another making the customer really unhappy along the way, like this…
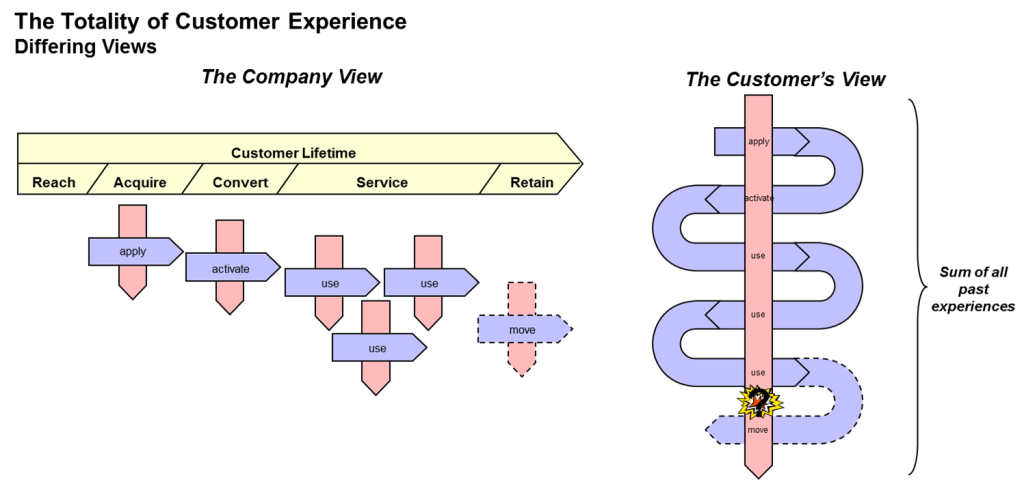
totality of customer experience

…because they needed to think outside-in (like the Customer), not inside-out (like a Company).

Then somebody had the bright idea to pull into a bit of control theory and cybernetics, and close the loop, so you get concepts like this virtuous cycle of analytical marketing…
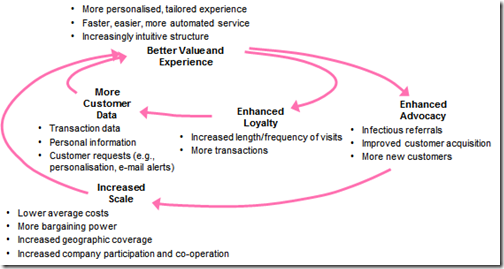
analytical marketing

…and get pestered many times a day to complete yet another bl**dy  survey.

M&S did not close the loop with me in my salad-based experience, their grizzly journey designed by trolls, gnomes and cockatrice, staffed by whey-faced minimum wage drudges and drones, toiling in their engine-room of despair.

Cloudy Big Iron and Big Data technologies now allow the feedback loop to be closed faster and in more ways than ever before, such that Amazon can now start shipping stuff before we know we want it…the Pre-Buying version of “Minority Report”’s Pre-Crime?

So where will it all end?

Maybe we can have Pre-Disposal where they ship the Pre-Broken consumer items direct to landfill…

…and “Pre-Paying” where they truncate the whole process and just take money from your bank for the stuff that you would have pre-bought…

…or there will be some sort of “howl round” when the positive feedback gets so intense the whole world just explodes in one enormous debauched orgasm of retail happiness. Wahooey!

Well, time will tell.  Apropos, Salvador Allende was assassinated in Chile as some of his ideas offended some powerful enemies, thus consigning one of the great experiments in cybernetic social feedback systems to history…so there is one lesson to consider.  And the meltdown of algorithmic automated trading systems, the never delivered promise of B2B eCommerce revenue forecasts from 2000, and don’t forget the weather, never forget the weather – a little bit of Chaos can through a massive stick into the bicycle wheel of predictive progress.

So let us continue this “Customer Journey Journey”, “Meta Journey” , or “Journey ^ 2” where it takes us, stepping out hopefully and with gladness and delight in our hearts, and a little small smile on our faces.

Yes, just like that

Amazon Might Try Shipping Things Out Before You Even Buy Them

I suppose that is where one path of ‘Big Data’ predictive analysis might take you…

Amazon Might Try Shipping Things Out Before You Even Buy Them – http://pulse.me/s/KUjvv

Posted from WordPress for Android

3D food printers debut at CES

Yup, that might start to fill the bill for “mass customisation” envisaged by Alvin Toffler

3D food printers debut at CES http://www.bbc.co.uk/news/technology-25647918

Posted from WordPress for Android

BMW demos ‘drifting’ self-drive car

Sounds like that could be real fun…

BMW demos ‘drifting’ self-drive car http://www.bbc.co.uk/news/technology-25653253

Posted from WordPress for Android

Row over US ‘cockroach backpack’

Roaches are fairly universally unloved, but they don’t deserve this

Row over US ‘cockroach backpack’ http://www.bbc.co.uk/news/science-environment-24455141

Posted from WordPress for Android

The Scientifically Best Time to Drink Your Coffee

About every 45 minutes between 9am and 6pm works for me…

The Scientifically Best Time to Drink Your Coffee – http://pulse.me/s/w10Ay

Posted from WordPress for Android